Research - (2023) Volume 11, Issue 1
System Design for An Intelligent Agronomic Advisory Application
Kile Awuna Samuel1*, Ebem Deborah2 and Adegoke, O. Folake32Department of Computer Science, University of Nigeria, Nsukka, Nigeria
3Department of Computer Science, Prince Abubakar Audu University, Anyigba Kogi State, Nigeria
Received: Dec 22, 2022, Manuscript No. IJCSMA-22-84439; Editor assigned: Jan 11, 2023, Pre QC No. IJCSMA-22-84439 (PQ); Reviewed: Jan 18, 2023, QC No. IJCSMA-22-84439 (Q); Revised: Jan 23, 2023, Manuscript No. IJCSMA-22-84439 (R); Published: Jan 30, 2023, DOI: 10.5281/zenodo.7824499
Abstract
System designs plays crucial role in applications development. This is because the intended user only interfaces with the output of the executed codes of the application which is also designed for effective user understanding, making it the hub of system/application development. It is therefore very important in the development of the intelligent agronomic system since it shows clearly how the basic elements of the application will be interacting. So many applications exist without proper documentation of their designs defeating the importance of system design in software development. As such, the study aims towards achieving the system analysis and design for the intelligent agronomic advisory system. This is achieved using the unified modeling language structures like the use-case diagram, sequence diagram and database design. With this, it will be very clear for developers, users and researchers in making better their software.
Keywords
Agriculture; Crop; Design; Unified Modeling Language (UML); Software and system
Introduction
Software applications have impacted in processes to ease human life and operations. One major area of these applications is the agricultural operations. Agricultural operations have been positively impacted by the use of applications developed by way of increasing crop yield, enhancing best crops’ sales price, monitoring crops’ growth and animal movement amongst others.
Despite the huge advantage been offered by agricultural, its services lacked high level precision because most of its operations are done based on mere assumptions. These often lead to high inefficiency like low yield, low pricing and poor market for agricultural produce. These impliedly affect agricultural produce in that most farmers could not produce crops to meet the expected demand because of lack of precision tools, poor marketing and others. These decline in agricultural produce has resulted to low inputs to most agro allied based industries, decline in GDP, increased poverty, insecurity and many other problems that have risen due to low agricultural productivity. Be it as it may, researches have been done and many are ongoing towards solving these problems. Famous are arrays of crop production enhancements software and other applications that can be used for animal monitoring, et.c. These are applied towards making impact in agricultural productivity and results are being achieved towards the utilization of these applications. Sadly, most of these applications developed are not user friendly because they were designed not considering the users who are mostly peasant farmers that lack basic knowledge on the usability of these systems. The designs are complex and require a high level of sophistication for them to be fully understood and used by major stakeholders in the agricultural production sector. The design achieved in this study applied simply and effective methods/approaches and used the best of design technologies and tools so that users of the application can effectively navigate with ease the functionalities of the application and generate needed results without much stress.
Satzinger et al. (2002, as cited by Singh and Kotze (2003, gave a more specific definition of an information system where they stated that an information system is a collection of interrelated components that collect, process, store, and provide as output the information needed to complete a business task [1, 2].
Waldo (2006, expressed that carefully designed systems, in which the right abstractions are combined in just the right way to produce a system that is easy to learn, easy to change, and pleasing to use and work with, are unlikely to happen using the kind of design techniques that are popular today [3].
Fischer (1991, opined that high-functionality computer systems are designed systems. To comprehend designed systems, we have to understand the goals, functions, and adaptive capabilities for which they are used. The models associated with these systems are part of the design (i.e., they must be designed too, and they can and should provide important requirements for the design [4].
Agronomic systems are fast evolving without proper system analysis and design, leading to system failure and lack of duly expected results. These often give rise to increased cost of production and total loss of investment on the users, especially smallholder farmers and other stakeholders in the farm business. The study is aimed at using the object-oriented system analysis and design methodology and applying the Unified Modeling Language (UML) to achieve system design for an intelligent agronomic advisory system to be used by smallholder farmers and other stakeholders. Specifically, it will consider the use case, activity and sequence diagrams, and also the entity relationship diagram, using standard system design tool, the StarUML. The study will be beneficial to farmers, the agronomic business stakeholders, researchers, software developers amongst others [5].
2. System design
The design of this system will use the object-oriented systems development strategy and employ the Unified Modeling Language, (UML, using the StarUML as the design tool. UML diagrams to be applied here are; (2.1 use case diagram (2.2 activity diagram (2.3 sequence diagram and (2.4 class diagram
2.1 Use case diagram
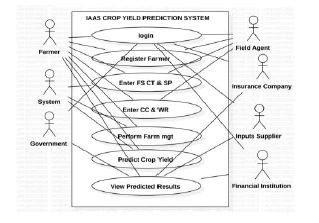
The use case diagram shows the activities that each of the users performs. The users (actors here are: Farmer, Government, Financial Institutions, Input Suppliers, Insurance Companies and Field Agents. It is represented as shown in Figure 1 below.
Figure 1: Use case diagram for the Intelligent Agronomic Advisory System (IAAS) for crop yield prediction.
Their functions of the users are:
2.1.1 Farmer:
The farmer can login to the system
Register himself on the system
Supply farm site and crop(s) type
Supply farm soil and climatic data
He can predict expected yield
He can also view results from the advisory system
2.1.2 System:
The system can bring out already defined site climatic conditions and water requirements Performs farm monitoring and evaluation It will perform prediction of expected crop yield on the farm location.
2.1.3 Field Agents:
They can login into the system
They can register farmers
They can also view results from the system
2.1.4 Insurance Companies
Can login into the system
Can view results from the advisory system
2.1.5 Farm Inputs Suppliers
Can login into the system
Can also view results from the advisory system
2.1.6 Financial Institutions
Can Login into the system
Can view results from the advisory system
2.2 Class diagram
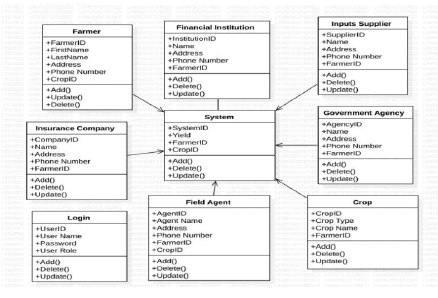
It is a static structure diagram employed in systems design in object-oriented systems development that describes the structure of a system by showing the system’s object classes, their attributes, methods or operations and the relationship that exists among the objects. It also describes the constraints imposed on the system. In summary, the class defines what the object can do in the system Figure 2 below. As the class diagram of the proposed system showing the relationship that exist among the objects and their attributes.
Figure 2: Class diagram for the intelligent agronomic advisory system
2.3 Activity diagrams for the intelligent agronomic advisory system
An activity diagram shows how dynamic the proposed system flows from series and sequence of activities and functions to be performed [6]. It represents an operation on a class in the system that results in a change of state of the system. For our proposed system, several entities of the system like farmer, financial institution, field agents, insurance company, government agencies, amongst others are been represented here to show the flow of activities from these entities.
2.3.1 The farmer activity diagram
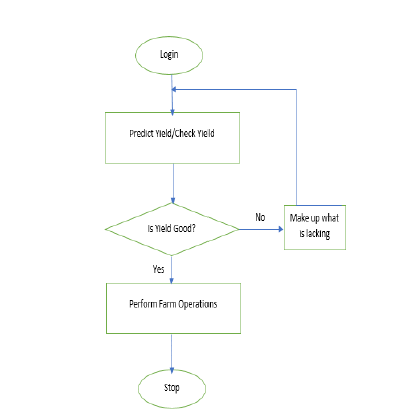
The farmer logs into the system using the farmer’s user name and password. He then predicts or checks the predicted yield. He further confirms whether the yield will be positive and if the confirmation is affirmative, the farmer proceeds to perform the expected farm operations or plan for a make-up of what may be lacking for the yield to be very good. He/she stops operations having exhausted all the processes by logging out of the system Figure 3.
Figure 3: Activity Diagram for intelligent agronomic advisory system; farmer.
2.3.2 Insurance Company Activity Diagram
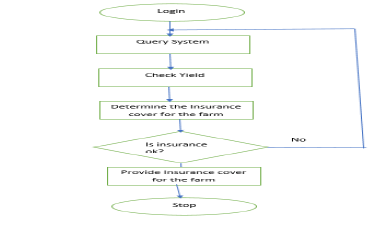
They provide insurance cover for farms in case of any eventuality. They log into the system and query to get the farmer details after which they check the predicted yield. They use that to determine the cover to give to farmers and also check if that will be enough. They may use the result to guide them towards providing the insurance cover and finally logs out if the processes are completed Figure 4.
Figure 4: Activity diagram for the intelligent agronomic advisory system; insurance company
2.3.3 Financial institution activity diagram
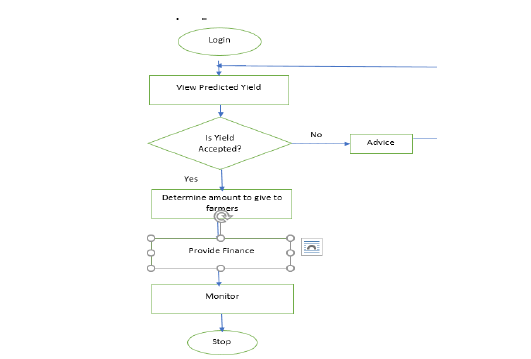
A financial institution here provides finances to the farmer to enable farming operations with a pay back after or during harvest. They also see the projected yield and determines the amount to give out to the farmers and also monitor the judicious application of the funds to avoid misapplication and ensure value for their money, after which the exit the system Figure 5.
Figure 5: Activity Diagram for the Intelligent Agronomic Advisory System; Financial Institution
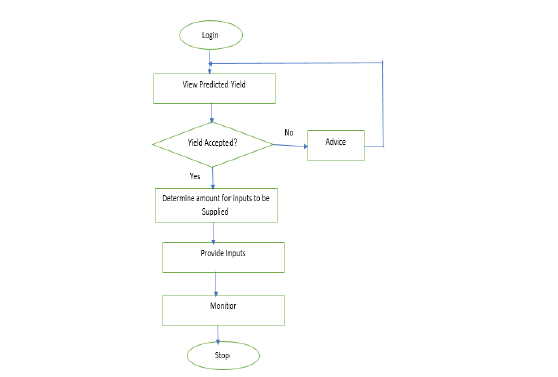
2.3.4 Inputs Supplier Activity Diagram
Activity diagrams are a relatively recent addition to the UML, and many people dislike using them because they are process-based, rather than object-oriented. The diagrams are a useful and effective modeling tool that can be used throughout the system development process(Figure 6).
Figure 6: Activity diagram for the intelligent agronomic advisory system; inputs supplier
2.4 Sequence diagrams for the Intelligent Agronomic Advisory Systems (IAAS)
This is an interaction diagram in the Unified Modelling Language (UML) of the object-oriented design in software engineering systems designs that describes how and in the order an object or a group of objects of the system designed works. It helps software developers and business analysts to know the requirements for a proposed system or aid towards documenting an already existing system [7]. The proposed system makes use of sequence diagrams that clearly show how the objects of the system work. Basic operations or works of the proposed system are represented here on sequence diagrams. These operations are login, farmer registration, supply of yield prediction variables or factors, activities of farm workflow management by the Colored Petri Nets, (CPN), and activities of crop yield prediction as performed by the machine learning algorithm, the Artificial Neural Network (ANN). Sequence Diagrams for the Intelligent Agronomic Advisory Systems (IAAS) (Figure 6).
2.4.1 Login sequence diagram
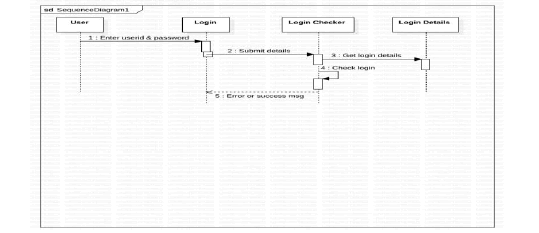
The user, being any participant in using the services offered by the application will have to provide registered login details which will be checked by the login checker, after which login takes place. Communication messages will be displayed indicating various stages of these activities like login success or not, user id and password and others Figure 7.
Figure 7: Sequence diagram for the IAAS-login.
2.4.2 Register Farmer Sequence Diagram
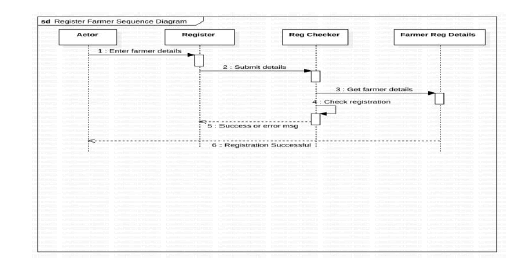
The actor which is the farmer will log in to the system after registering. The farmer is required to provide registration details to be captured by the applications database [8]. Messages are displayed to show whether the registration is successful or not and if not successful, the process is repeated to ensure success because that is the expected end result Figure 8.
Figure 8: Sequence diagram for farmer registration on the IAAS.
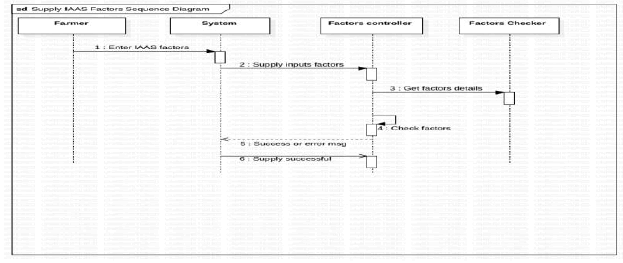
2.4.3 Sequence Diagram for the supply of inputs (variables) to the IAAS.
This sequence diagram has four lifelines represented as farmer, system, factors controller and factors checker. It basically shows how some factors or variables are supplied to the Intelligent Agronomic Advisory System (IAAS) by the farmer. The farmer who is the supposed major user supplies these factors or variables to the system from factor’s controller and the factors checker checks to ensure that all the factors supplied are as expected. The factors supplied here are farm size, crop type, climatic conditions, crop water requirement and soil properties Figure 9.
Figure 9: Sequence diagram for supply of factors on the IAAS.
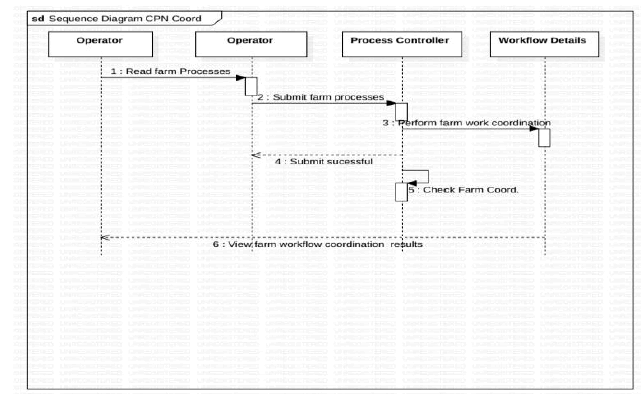
2.4.4 CPN sequence diagram showing farm works coordination
This diagram basically depicts the Colored Petri Net (CPN) component of the application. The operator lifelines could be farmer or any user like the field agent or both. The process controller lifeline checks to ensure that farm process activities are arranged as supposed while the workflow details lifeline ensures that the workflow coordination for the system is done according the time scheduled for each farm activity so that best crop yield is achieved if no step is missed at the appropriate time Figure 10.
Figure 10: Sequence diagram for workflow coordination on the IAAS.
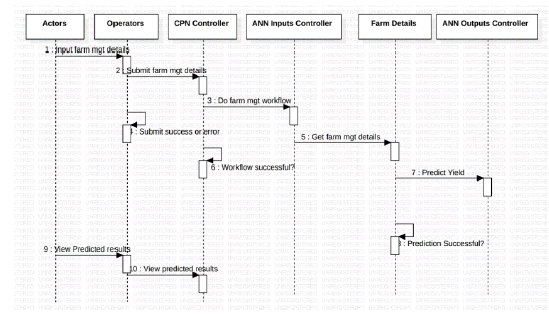
2.4.5 Yield prediction sequence diagram on the IAAS
This sequence diagram has six lifelines responsible for various operations on the system. The actors and operators could be farmers or field agents or both or any other interested partner in the services offered by the application. It basically oversees the crop yield prediction component of the software. Workflow coordination and yield prediction variables are supplied and checked to ensure that the crop yield prediction is successful. After all of that is achieved, the predicted yield is available to be viewed by the interested parties, which are the actors and operators Figure 11.
Figure 11: Sequence diagram for crop yield prediction on the IAAS.
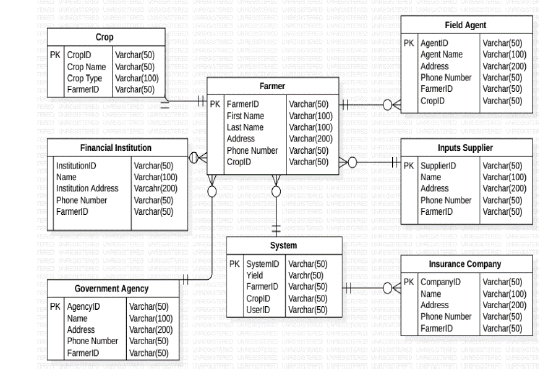
2.5 Database design for the agronomic advisory system
The system database is comprised of the following entities which has attributes that make up tables for the application. They are: Farmer, field agent, financial institution, government agency, inputs supplier, insurance company, login, crop type and system. The entity relationship diagram for the intelligent agronomic advisory model which is a conceptual representation of the database is shown the Figure 12 below:
Figure 12: Entity relationship diagram for the intelligent agronomic advisory system
3. Summary and Conclusion
The study achieved the design of an agronomic system that can be used to enhance crop yield prediction. The work considered standard methods/approaches and tools making the designed system to be highly simplified and effective in its operations. Design approaches like use case diagram, activity, sequence and entity relationships diagrams are achieved in the study using the Unified Modeling Language (UML) design methodology and applied the Star Unified Modeling Language (StarUML) design tool, giving a clear overview of how an agronomic system operates.
References
- Singh, S & Kotze, P. “An Overview of Systems Design and Development Methodologies with Regard to the Involvement of Users and Other Stakeholders.” Proc SAICSIT (2003): 37 – 47.
- Satzinger, John W., et al. “Systems analysis and design in a changing world.” Cengage learn (2015).
- Waldo, J. “On System Design.” Essay Ser Publ Sun Labs (2006).
[Google Scholar] [Cross Ref]
- Fischer, G. "The importance of models in making complex systems comprehensible." Hum Factors Inf Technol 2 (1991): 3-36.
- Ayana, C. S. “How Systems Designs Makes Teams Work Smarter, Not Harder.” (2021). [Google Scholar]
- Barshi, I. & D. L. Dempsey. "National Aeronautics and Space Administration (NASA).(2016)." Risk Perform Errors Due Train Defic.
- Anjum, M, & David B. "An investigation of modelling and design for software service applications." Plos One 12.5 (2017): 0176936.
- Simon, H. A. "The role of software engineering in systems for design and process control." J Integr Des Process Sci 5.3 (2001): 5-11.
